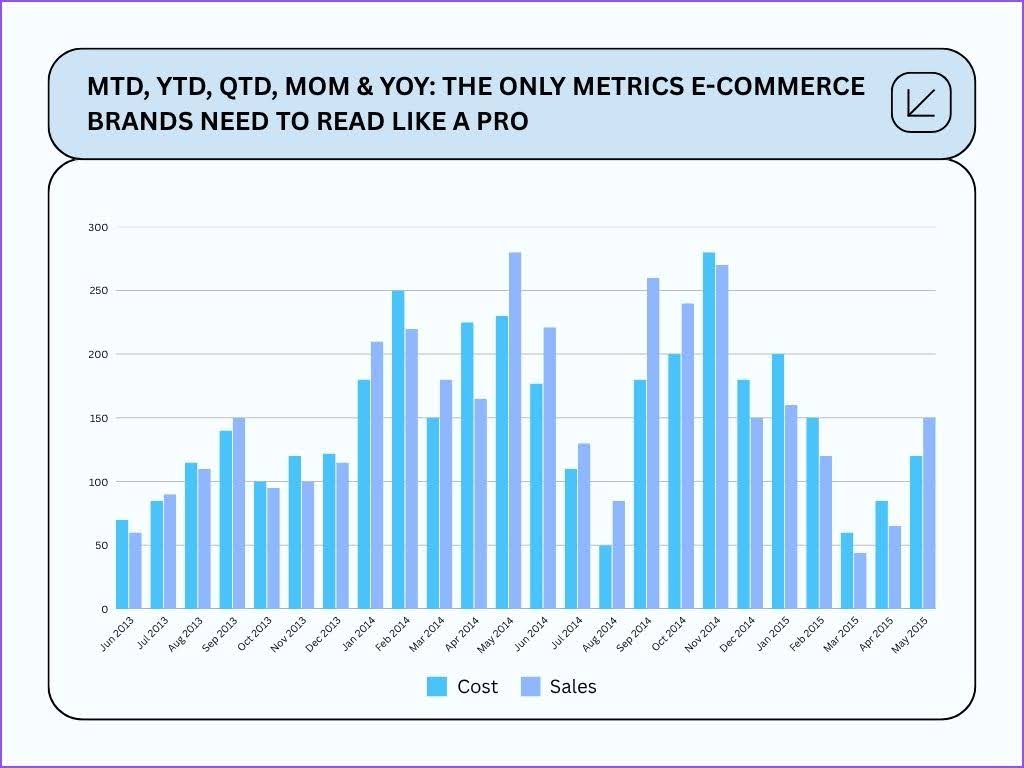
Ever feel like you’re drowning in data? Revenue charts, traffic graphs, ad reports—and suddenly everyone is throwing around acronyms like MTD, MoM, and YoY, as though you should already know them. If you have an online store, it’s mandatory to weigh these metrics.
In this blog, we’re leaning into the five time-based KPIs that every growing e-commerce brand should keep tabs on. Whether you’re optimizing your Shopify store, scaling a D2C brand, or utilizing digital marketing services to improve your numbers – these metrics will help you make more intelligent, quicker, and more confident decisions.
So What Do These Metrics Tell You?
Here’s the breakdown:
- MTD full form is Month-To-Date, which indicates your performance and activity for the current month.
- QTD full form is Quarter-To-Date, which looks at your current quarter.
- YTD full form is Year-To-Date, which lets you see your performance from the first of the year to today.
- MoM full form is Month-over-Month, which checks how this month is doing compared to last month.
- YoY full form is Year-over-Year, which shows how you are doing compared to the same period last year.
If you’ve ever searched how to track e-commerce sales growth or which e-commerce KPIs matter most, you’ll want to make sure you keep these five metrics front of mind.
1. MTD Meaning: How’s This Month Shaping Up?
Let’s assume that it’s August 17, and your store shows ₹8.5 lakhs in revenue. Last month, you ended up with ₹12 lakhs, so with two weeks left, you’re at over 70%. That’s pretty incredible, right?
When you track your revenue on a month-to-date basis, you can be proactive. Instead of waiting for an end-of-month report, you can see what’s working RIGHT NOW, and adjust your ad spend, email cadence, or inventory plan while you can still impact it.
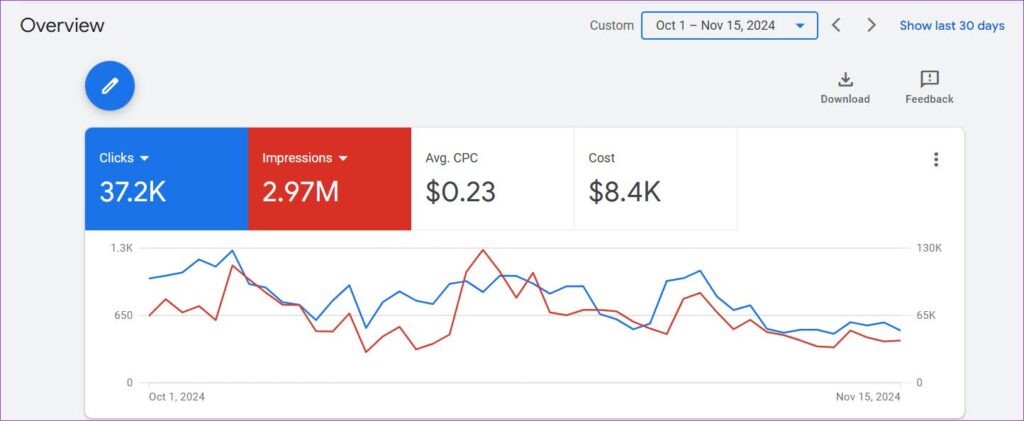
This is useful for Shopify sellers and Amazon brands that want e-commerce analytics data in real time, without being buried in spreadsheets.
2. QTD Meaning: Are You On Pace for the Quarter?
Now let’s pull back a bit. It’s now August. You’ve done ₹27 lakhs thus far since July 1. That’s your quarter-to-date revenue. We were projected to finish last quarter with ₹21 lakhs by this time, meaning you’re trending up 28%.
QTD is absolutely gold when preparing for quarterly reviews on your business results, preparing pitch decks, or planning your inventory stock for Q4. Brands with subscription models, as well as seasonal brands (hey there fashion and wellness brands!), are all planning for upcoming upticks in sales using QTD to avoid stockouts or surprises in cash flow.
More and more brands are developing custom ecommerce dashboards with QTD and YTD metrics using tools like Power BI and Looker Studio to make this information available at a glance.
3. YTD Meaning: Are You Growing This Year?

This is your overall outlook. If YTD was ₹1.25 Cr and last year you were ₹95 lakhs as of August, congrats, you’re up by 31%.
This is an e-commerce KPI that is most often referred to for brands that are trying to achieve year-on-year growth, or better profit margin, or if they are engaged in fundraising. D2C founders love it because it allows them to build a consistent narrative: they are not just evaluating what happened last month, but they can assess the whole year’s development.
4. MoM Meaning: Are You Improving Month to Month?
Here’s where it gets interesting. In July, you earned ₹16 lakhs; that’s up from ₹13 lakhs in June. A month-over-month growth rate of 23%,
But MoM isn’t just about revenue. Savvy marketers use MoM growth rates to measure changes in conversion rates, cart abandonment recovery, email clickouts, or changes in CAC vs LTV. Demut your fastest loop of feedback—and help you measure the true ROI on a new campaign, influencer collaboration, or pricing change.
This also matters if you’re in a fast-moving category like skincare, fashion, or electronics—and a 5-day promotion can change everything about your monthly comparison.
5. YoY Meaning: Are You Beating Last Year?
Imagine the best-case scenario… last August, you made ₹11 lakh. By August 20 this year, you will be at ₹14.5 lakh. That’s an incredible 32% YoY growth.
This is your reality check. Is your Diwali sale performing better – or have you just paid more for it? Are your product bundles resulting in greater AOV than last year?
If you are taking short or medium-term growth approaches by way of content marketing or SEO, YoY is sheerly your friend. That’s how you measure compound returns. And if that is where you are focusing your efforts, it is well worth finding SEO services that provide the benefits of driving successful growth over time, without relying on annual increases in ad spend.
How Do You Track These KPIs?
The maths is straightforward:
- MTD / QTD / YTD: Simply sum the total of all of your results from the beginning of the period to today.
- MoM Growth (%) = (This Month – Last Month) ÷ Last Month × 100
- YoY Growth (%) = (This Year – Last Year) ÷ Last Year × 100
However, in 2025, this will be automated by most growing e-commerce teams. There are countless ecommerce dashboard templates you can find online – or build your own in Data Studio, Power BI, or even in Shopify’s built-in analytics if you are using the advanced plan.
Final Thoughts: Don’t Just Track Data—Use It (MTD vs MoM vs YoY)
Data is only valuable if it helps you take action faster and smarter.
Use MTD to see if you are on track with this month’s campaigns.
Use MoM to assess whether last month’s test campaigns drove sales.
Use YoY to rationally talk yourself into bigger goals (or bigger budgets).
These five KPIs are the beating heart of any scalable ecommerce business, especially in a landscape based on trends, sales cycles, and changing ad costs.
Are You Ready to Track Smarter?
Do you want help creating a dashboard with these KPIs baked? Do you want a performance audit to learn where you’re leaking revenue?
Get in touch if you want us to review your ecommerce business data and help you build a dashboard